Silver Holds Above $63 Support Amid Rising Oil and Dollar Strength

Silver prices trade at $63.90, holding above a critical support zone. Fed rate hike expectations and surging oil prices pressure the metal.
Silver (XAG/USD) trades at $63.90 in early European session trading. The metal is testing a key support level near $63.00. Bears hold the near-term technical advantage. Market sentiment has turned negative for precious metals.
Strong US inflation data has increased expectations for a Federal Reserve rate hike. The US Dollar has strengthened in response. Higher oil prices further complicate the macroeconomic outlook. These factors create headwinds for silver.
Inflation Data Drives Dollar Gains
US Consumer Price Index figures released on Friday exceeded forecasts. Core inflation rose at its fastest pace in four months. This data suggests the Fed may hike rates by 25 basis points on Wednesday. A rate hike typically strengthens the US Dollar.
A stronger Dollar makes silver more expensive for holders of other currencies. This dynamic often suppresses demand for the metal. The market is pricing in a higher probability of tightening monetary policy. This outlook weighs on silver prices.
Oil Supply Disruptions Raise Inflation Fears
Geopolitical tensions in the Middle East have disrupted oil supply routes. The Strait of Hormuz has been closed for six months. Houthi militias have seized areas to close the Strait of Bab el-Mandeb. These actions restrict crude oil transport from Gulf countries.
Brent oil prices have risen above $103.00. The six-month high of $106.40 is now in view. Elevated energy costs contribute to global inflation pressures. This environment is unfavorable for non-yielding assets like silver.
Technical Support and Resistance Levels
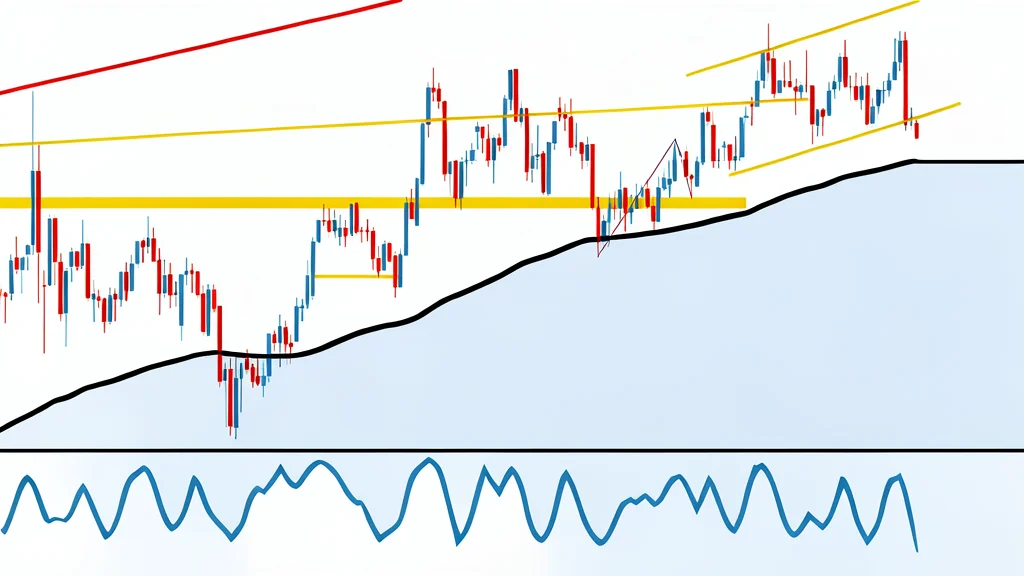
Silver trades above the neckline of a bearish Head and Shoulders pattern. Momentum indicators on the daily chart show negative bias. The Relative Strength Index remains below the 50 midline. The MACD histogram displays widening red bars.
Key support lies between the August 19 low of $62.19 and the September 2 low of $63.32. A break below this zone targets the August 6 low at $60.87. The measured target for the bearish pattern is near the year-to-date low of $54.77. Resistance appears at Friday's high of $65.30. A break above that level opens the path to highs above $68.00.