Aussie Property Listings Hit Decade High
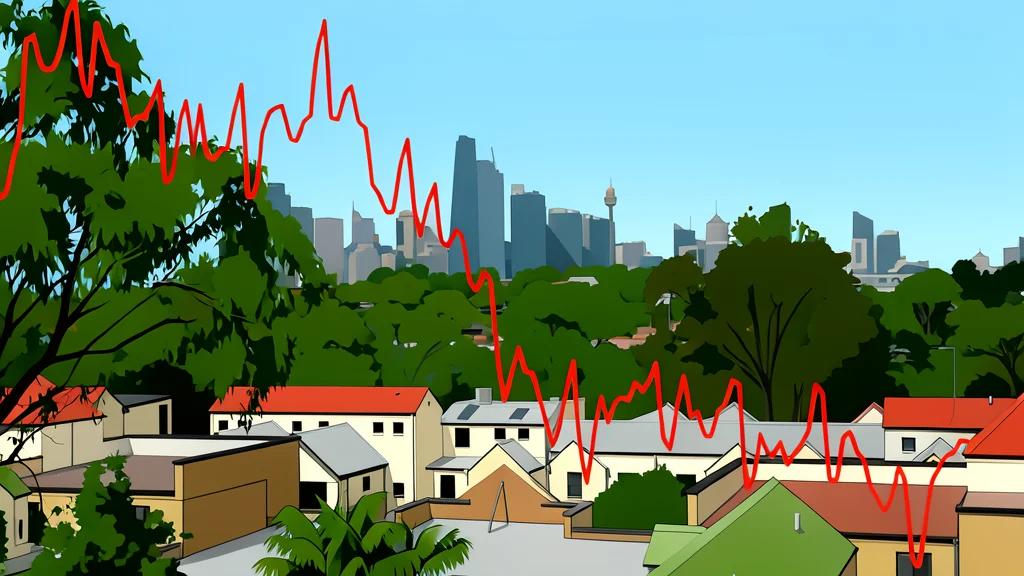
Australian housing stock grew 16.1 percent year on year in August.
Australian housing stock grew 16.1 percent year on year in August. This marks the highest level of growth since February 2016. The figure signals a sharp reversal in a decade-long downward trend.
National listings dropped to a record low of 105,000 in January. That figure was the lowest on record since data began in 2009. The market has since shifted rapidly toward increased supply.
Supply trends reversed sharply
Home listings halved between 2015 and 2024. The peak stock of 259,000 units in 2015 fell to 128,700 by late last year. This scarcity drove price increases over the past six years.
The shift began in May when year-on-year growth turned positive. By August, the growth rate hit 16.1 percent. This represents the strongest expansion in over a decade.
Regional disparities remain wide
National averages mask significant regional differences. Data from GN auto markets/housing: housing prices shows two distinct market speeds. Some areas see steady supply increases while others remain tight.
The baseline for comparison is August 2019. This period marks the pre-pandemic market conditions. Current data reveals a fragmented landscape across cities and regions.