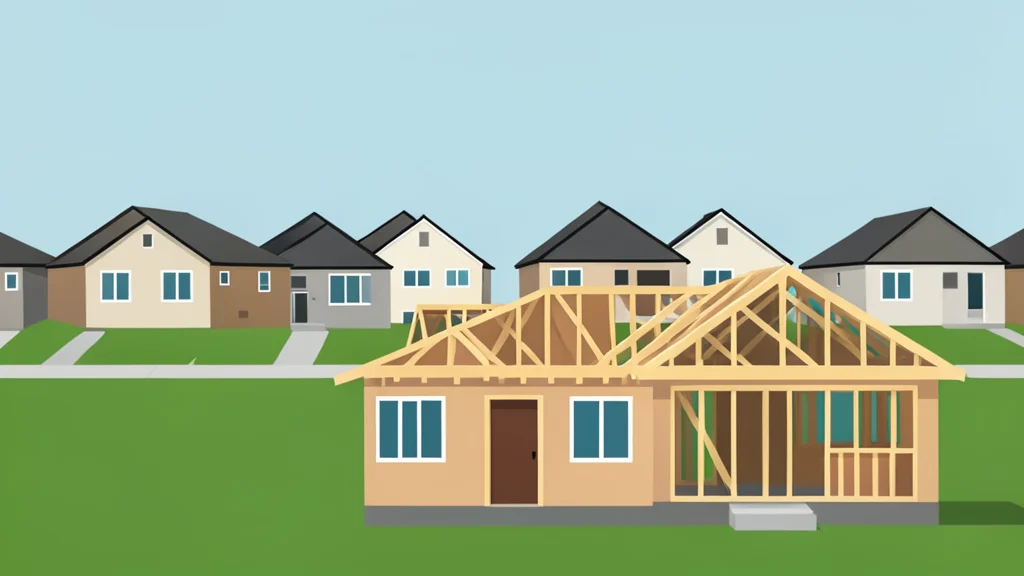
Existing Home Sales Fall to 3.98 Million Annual Rate
Existing home sales dropped 2% in August as mortgage rates held above 6.5%. Inventory hit 1.62 million units, the highest level since 2019.
Existing home sales declined 2% in August to a seasonally adjusted annual rate of 3.98 million. This marks the first time the sales pace fell below four million since June 2025. The drop was driven by sustained high borrowing costs that limited buyer demand.
The average rate on a 30-year fixed-rate mortgage stood at 6.67% in August. This was higher than the 6.54% recorded in July and the 6.59% seen a year earlier. NAR Chief Economist Lawrence Yun cited these elevated rates as the primary factor suppressing transaction volume.
Housing inventory reaches decade high
Total housing inventory climbed to 1.62 million units at the end of August. This represents a 3.2% increase from July and a 5.9% rise from a year earlier. It is the first time inventory has exceeded 1.6 million homes since November 2019.
The months of supply rose to 4.9, up from 4.6 in July. This is the highest level in more than a decade. The typical home stayed on the market for 31 days, compared to 29 days in the previous month.
Greater supply provides buyers with more leverage in negotiations. Shoppers face less pressure to make immediate offers. This shift may allow for more discussion on price and repair costs.
Median prices continue to rise
The median existing-home price reached $429,100 in August. This is a 1.6% increase from $422,400 a year earlier. Prices have risen for 38 consecutive months on a year-over-year basis.
Regional performance varied significantly. The Northeast saw the strongest price growth at 4.3%. The West was the only region where prices declined, dropping 0.2% to a median of $619,100. Sales fell 4% in the Northeast and 3.1% in the Midwest.
First-time buyers share increases
First-time buyers accounted for 30% of August transactions. This is up from 29% in July and 28% a year earlier. All-cash purchases made up 27% of total sales.
The NAR Housing Affordability Index improved to 104.7 from 101.2 a year earlier. Affordability metrics improved in all four regions. These trends indicate a shifting dynamic in the US housing market.