GRAIL Shares Jump 34% on FDA Galleri Test Review Hopes
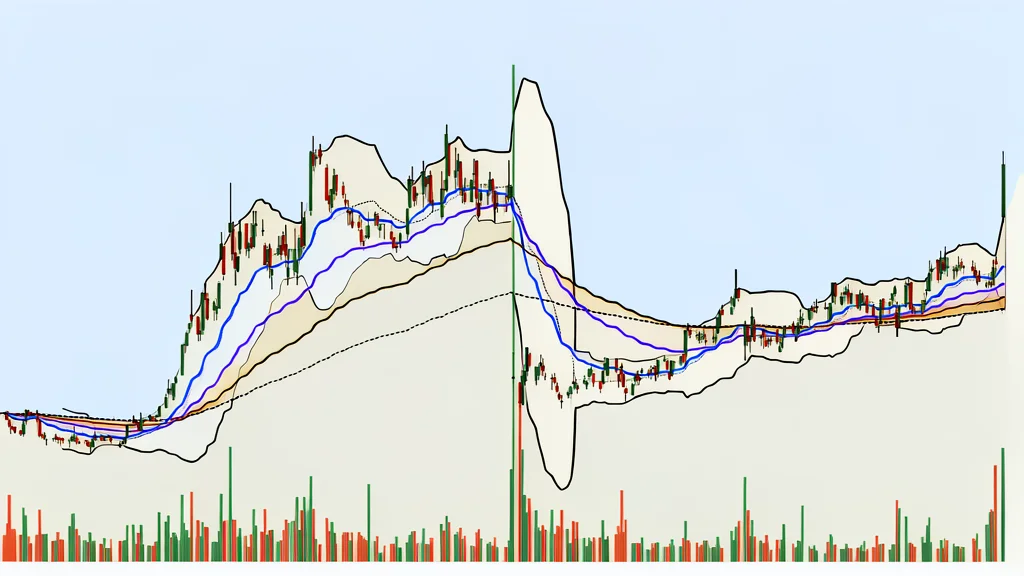
GRAIL stock closed at $107.97 after FDA briefing documents boosted approval odds for the Galleri test.
Key points
- GRAIL stock rose 33.68% to close at $107.97 on September 21, driven by FDA briefing documents for the Galleri test.
- The FDA Advisory Committee will review the Galleri cancer detection test on September 23, serving as the next major catalyst.
- Daily RSI hit 81.04, indicating deep overbought conditions, while RBC Capital Markets set an $84 price target below the current price.
GRAIL, Inc. shares closed at $107.97 on September 21, marking a 33.68% gain that pushed the stock well above its recent volatility ranges. The surge followed the release of FDA briefing documents that heightened expectations for the Galleri multi-cancer early detection test ahead of a key regulatory milestone.
According to The Cryptonomist, the stock’s intraday high reached $111.50, significantly outpacing its 20-day moving average of $80.36. This move reflects a sharp revaluation of the company’s risk profile as investors price in the potential for a positive regulatory outcome.
FDA Advisory Committee Sets Next Catalyst
The FDA Advisory Committee is scheduled to meet on September 23 to review the Galleri cancer detection test. This event serves as the primary near-term catalyst for GRAIL, with the briefing documents already shifting market sentiment toward a favorable decision.
RBC Capital Markets initiated coverage on September 17 with a Sector Perform rating and an $84 price target. This valuation sits below the current trading price, indicating that some institutional investors view the recent spike as ahead of fundamental justification.
Technical Indicators Signal Overbought Conditions
The daily Relative Strength Index (RSI) reached 81.04, placing the stock in deep overbought territory. Price closed at $107.97, well above the upper Bollinger Band of $93.75, a statistical extension that typically precedes a corrective pullback or consolidation period.
While the daily MACD histogram remains positive at 1.59, confirming underlying bullish momentum, the 15-minute MACD has flipped negative. This short-term divergence suggests that immediate buying pressure is cooling as traders digest the large single-day move.
Volatility Expands Across Timeframes
The 14-day Average True Range (ATR) expanded to 5.72, confirming a sharp increase in price volatility. On the one-hour chart, the RSI sits at 82.22, mirroring the extreme conditions seen on the daily timeframe and highlighting the stretched nature of the recent rally.
Support levels are now identified at $96.15 on the daily chart, while resistance stands at $115.65. The tight trading range on shorter timeframes indicates the market is currently consolidating rather than immediately extending the gap created by the FDA news.