Gold Rebounds to 4,383 Dollars After Fed Hike
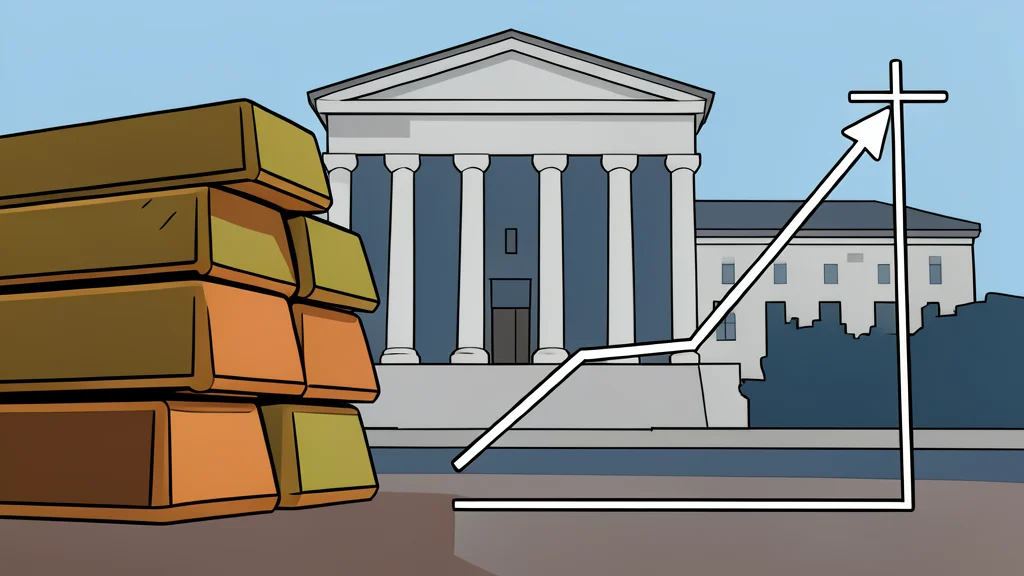
Gold recovered to 4,383.45 dollars per ounce following the Federal Reserve's first rate hike since 2023, defying expectations of a sustained decline.
Gold reached 4,383.45 dollars per ounce on September 18. This level represents a 0.97% daily gain. The metal recovered after an initial drop to 4,315.20 dollars. The Federal Reserve raised its benchmark rate by 25 basis points. The new target range is 3.75% to 4.00%. This is the first increase since 2023. The vote was unanimous at 12 to 0. Traders initially sold the asset as the dollar strengthened.
The market expected a decline due to higher interest rates. Higher rates reduce the appeal of non-yielding assets. Gold did not stay at the intraday low. It climbed back toward the 4,400 dollar level. This resilience occurred despite hawkish signals from the central bank. The metal remains down for the month. However, it did not crash as typical models predict.
Fed Signals Tighter Policy Path
Federal Reserve Chair Kevin Warsh prioritized price stability. He took office on May 22. His stance shifted the market focus from cuts to hikes. Inflation remains above target levels. The Fed stated it is willing to tighten further. This message unsettled gold investors. The central bank rejected softer labor market readings. Discipline is the core of the current policy framework.
The August speech at Jackson Hole set the tone. Gold fell more than 1% after the remarks. Spot gold traded near 4,552 dollars at that time. Investors interpreted the comments as a signal for a September hike. The Fed’s decision confirmed this hawkish bias. The 12-0 vote underscores the internal consensus. No dissent was recorded in the statement.
Miner Stocks Outperform Bullion
Gold mining stocks showed strong momentum in August. The NYSE Arca Gold Miners Index climbed 33%. Gold prices jumped 10% during the same period. Miners move faster than bullion due to fixed costs. This leverage effect amplifies directional moves. The rally relied on the debasement trade. Investors sought hard assets amid fiscal risks. Geopolitical fractures also supported the demand.
This dynamic creates volatility for equity holders. The shares exaggerate the metal's direction. Positive moves are larger. Negative moves are also steeper. The August performance highlights this risk. Investors must monitor both sectors. The correlation between miners and bullion is tight. Any shift in gold prices impacts miner earnings directly.
Long-Term Forecasts Remain High
Gold sits far below its January record. The all-time high was 5,589.38 dollars per ounce. This peak occurred on January 28, 2026. The current price is roughly 28% lower. Nearly 18 billion dollars left gold ETFs since the peak. The market questions if January was the top. Or if it was just the first peak.
J.P. Morgan Global Research expects higher prices. The bank forecasts an average of 6,000 dollars per ounce. This target applies to the fourth quarter of 2026. A level of 6,300 dollars is possible in 2027. These figures rely on fiscal risk and policy uncertainty. Inflation worries continue to drive the outlook. The forecast is not cautious. It assumes sustained demand for hard assets.