Gold's 23% CAGR Since 2019 Masks Long Periods of Zero Returns

Gold prices hit 13,961 rupees per gram in August 2026. Historical data shows frequent multi-year pauses in value growth despite strong long-term performance.
Gold has generated a compound annual growth rate of 23% between 2019 and August 31, 2026. The metal's price stood at 13,961 rupees per gram at the end of that period. This represents a 13.1% increase from the 12,349 rupee level recorded one month prior. However, the price had peaked at 15,292 rupees per gram just six months earlier. This decline illustrates the volatility inherent in the asset even during a strong bull market.
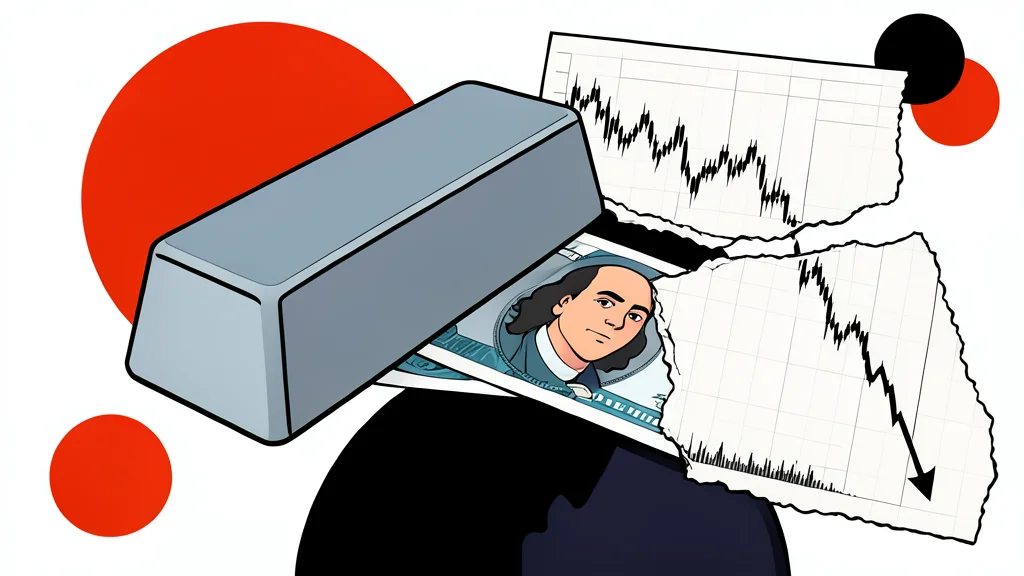
The recent outperformance does not reflect the entire history of gold. The metal has experienced multiple extended periods where returns hovered near zero. According to data cited by GN auto markets and commodities, gold delivered approximately 0% returns between 1980 and 1989. A similar pattern occurred between 1996 and 2002, and again from 2012 to 2019. These flat periods interrupted longer cycles of growth. Investors who entered during these stagnant phases faced years of unrealized gains or losses.
Historical Returns Show Cyclical Patterns
Performance metrics vary significantly depending on the time horizon. Gold returned 17.3% annualized over a ten-year period. The rate dropped to 14.5% over twenty years. Over thirty years, the annualized return was 12.2%. The forty-year figure stood at 11.9%. These figures come from the September 2026 FundsIndia Wealth Conversations report. The data confirms that gold outpaces inflation over long horizons. Yet the path to those returns includes significant stagnation.
The cycle from 1989 to 1996 saw a 12% compound annual growth rate. This was followed by the flat period until 2002. From 2002 to 2012, gold delivered a 19% CAGR. The subsequent seven years saw no growth. The current cycle, starting in 2019, has produced the 23% CAGR noted above. This sequence suggests that strong returns are often followed by years of muted performance.
Inflation Defines Conservative Return Estimates
Analysts recommend using inflation as a baseline for future expectations. FundsIndia estimates gold has outperformed inflation by 5% to 6% over horizons of at least 21 years. A more conservative assumption places the premium at 2% to 4% above inflation. India's Consumer Price Index inflation stood at 4.82% in August 2026. Applying the conservative range yields a potential long-term return of 6.82% to 8.82% per year.
This calculation provides a realistic benchmark for wealth preservation. It is not a forecast for the immediate future. The recent 23% CAGR should not be treated as a sustainable annual target. Investors must account for the possibility of multi-year stagnation. The asset functions as a store of purchasing power over decades. Short-term price swings can erode confidence if expectations are set too high.
Macroeconomic Factors Drive Rupee Price
Several variables influence gold prices in Indian rupees. Central bank demand is a primary driver. US real yields also play a significant role. Mining costs and money supply levels contribute to valuation. The USD/INR exchange rate directly impacts the local price. A weaker rupee can boost gold's value in domestic terms. These factors interact in complex ways. They create the volatility observed in recent months.
Investors should view gold through a long-term lens. The asset has a track record of preserving value against inflation. However, it is not a high-growth equity alternative. The history of zero-return periods is a critical part of the risk profile. Portfolio construction must reflect this reality. Expecting consistent double-digit growth is unsupported by historical data. Patience is required to navigate the flat phases.