Silver Drops 1.5% to $63.60 as Neckline Resistance Holds
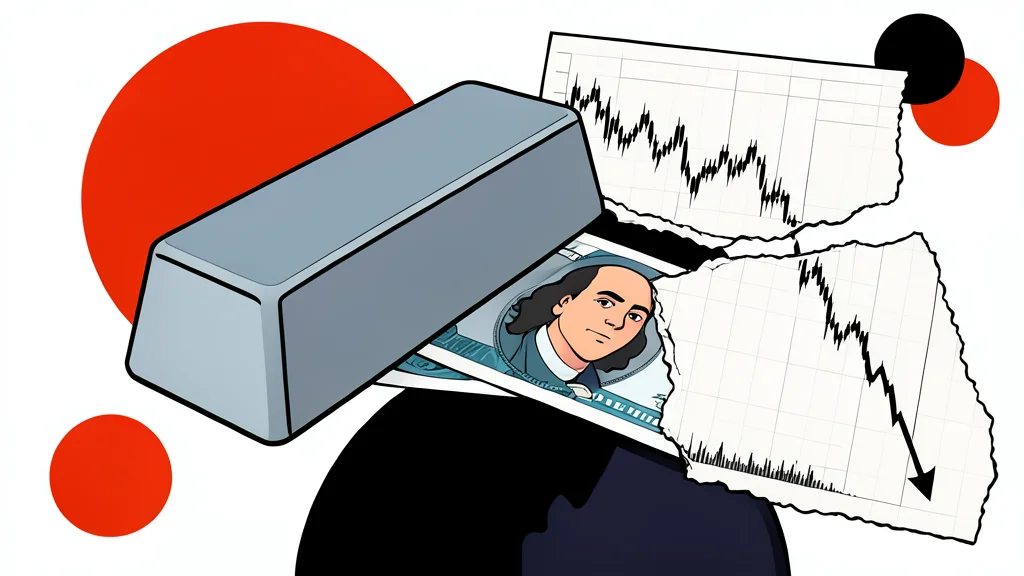
Silver prices fell 1.50% on Monday, trading at $63.60. The metal failed to break above the $64.10-$64.20 resistance zone, keeping a bearish chart pattern intact.
Silver (XAG/USD) closed lower on Monday with a loss of 1.50%. The price stands at $63.60. Buyers could not push the metal above the $64.10 to $64.20 range. This failure keeps the head-and-shoulders pattern active. Sellers maintain control in the short term.
The Relative Strength Index sits below the 50-neutral level. This indicates bearish momentum. The market structure suggests further downside if support breaks. The 50-day Simple Moving Average is a key technical level to watch.
Support Levels Define Risk
The first major support sits at $63.00. A break below this level exposes the 50-day SMA at $62.59. The next target is $62.00. Weakness beyond these points targets the $60.00 area. The pattern measures a potential drop to $55.00.
Bullish Scenario Requires Strong Reversal
Buyers must clear the right shoulder to invalidate the bearish view. The September 9 peak stands at $68.33. Passing this level is necessary to negate the head-and-shoulders pattern. A successful breakout would open the path to $70.00.
Market Context and Drivers
Silver acts as a safe-haven asset and industrial metal. Its price correlates with gold and the US dollar. A stronger dollar typically pressures silver prices. Industrial demand from electronics and solar sectors influences valuation. According to GN auto markets/commodities: silver prices, technical structure currently favors sellers.