GE Vernova vs NextEra Energy: 2026 Financial Breakdown
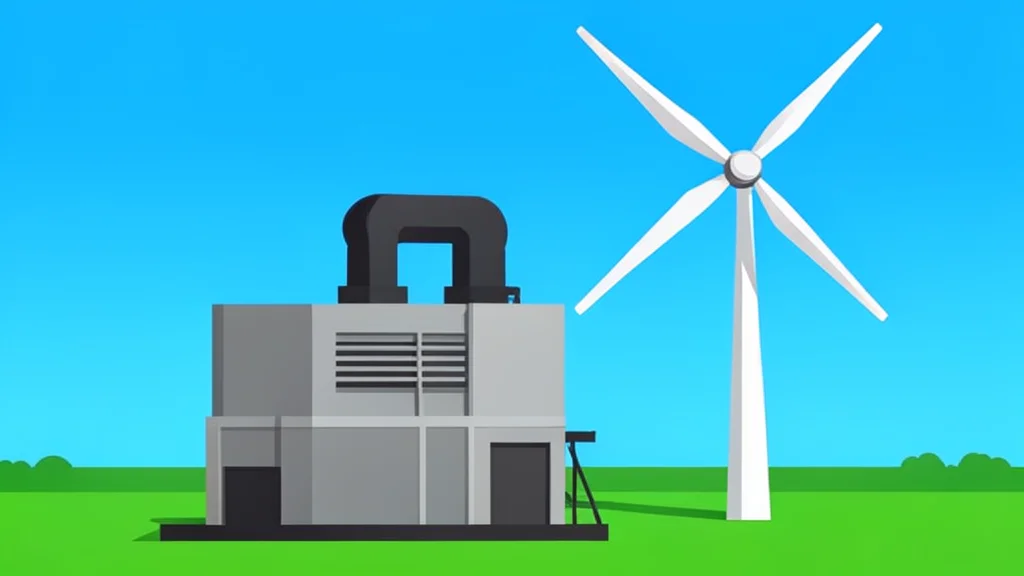
GE Vernova and NextEra Energy present distinct value propositions for 2026, with the former showing a debt-free balance sheet and the latter offering higher margins.
GE Vernova and NextEra Energy represent two sides of the evolving power grid, offering investors a choice between hardware manufacturing and utility operations. GE Vernova supplies the turbines and grid equipment that generate roughly 25% of global electricity, while NextEra Energy manages the distribution and renewable development for over six million customer accounts. Both companies benefit from rising demand, but their financial structures and growth drivers differ significantly.
The comparison hinges on how each firm handles the capital-intensive nature of the energy transition. GE Vernova focuses on high-margin hardware sales, whereas NextEra Energy relies on regulated utility revenues and renewable asset expansion. Understanding their respective balance sheets and cash flow profiles is essential for evaluating their long-term viability as the grid modernizes.
FY 2025 Revenue and Profitability
GE Vernova reported FY 2025 revenue of nearly $38.1 billion, marking an 8.9% year-over-year increase. The company generated net income of approximately $4.9 billion, resulting in a net margin of 12.8%. This performance reflects strong demand for its power generation and transmission equipment, which serves both utility and industrial clients.
NextEra Energy recorded FY 2025 revenue of about $27.5 billion, representing an 11% growth rate. Its net income reached nearly $6.8 billion, yielding a net margin of around 20%. The higher margin underscores the profitability of its regulated utility segments, particularly Florida Power & Light, despite the capital intensity of its renewable energy development arm.
Balance Sheet Strength and Liquidity
As of December 2025, GE Vernova maintains a debt-to-equity ratio of 0.0x, indicating it carries no net debt relative to its equity base. Its current ratio stands at approximately 1.0x, suggesting liquid assets cover short-term liabilities. Free cash flow was nearly $3.7 billion, providing substantial flexibility for reinvestment or shareholder returns.
NextEra Energy shows a debt-to-equity ratio of 1.8x, meaning total debt is nearly twice shareholder equity. The current ratio is roughly 0.6x, indicating short-term liabilities exceed short-term assets. Despite this leverage, the company generated approximately $3.2 billion in free cash flow, supported by its stable utility cash flows and ongoing renewable project completions.
Valuation Metrics and Risk Factors
Valuation data from Financial Modeling Prep indicates NextEra Energy trades at a forward P/E of 20.5x and a P/S ratio of 6.3x. GE Vernova commands a premium, with a forward P/E of 31.2x and a P/S ratio of 6.7x. This premium reflects the market’s higher growth expectations for hardware manufacturers compared to regulated utilities.
Risk profiles diverge significantly. GE Vernova faces supply chain volatility for semiconductors and critical raw materials, along with competition from state-backed international firms. NextEra Energy encounters regulatory hurdles in rate cases and its planned acquisition of Dominion Energy. Operational risks at nuclear facilities and development delays in solar and wind projects also pose challenges for the utility operator.