New England Hits 500 Duck Curve Days as Solar Output Surges
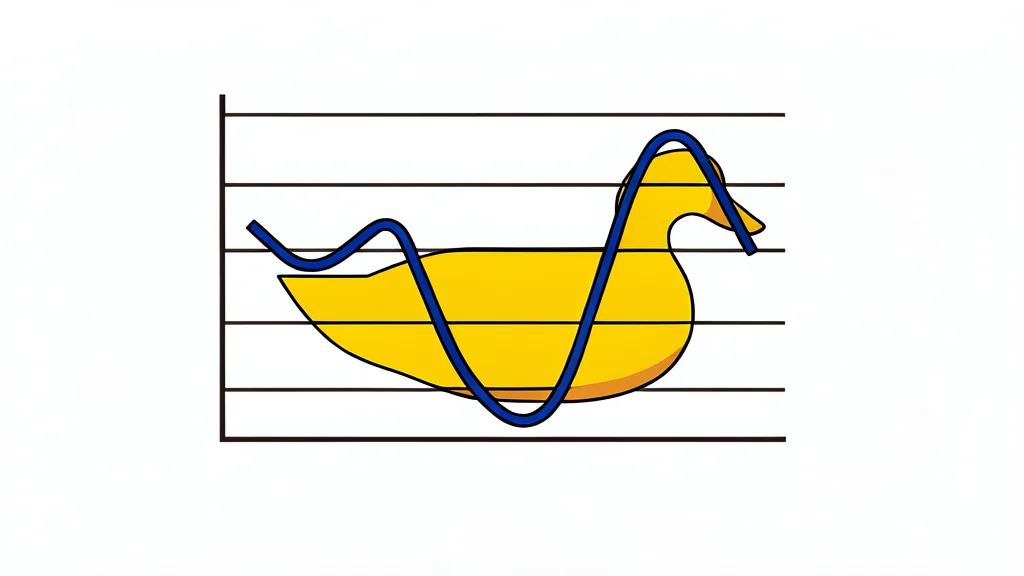
ISO New England recorded its 500th duck curve day in September, marking a rapid acceleration in midday demand drops driven by behind-the-meter solar.
Key points
- ISO New England recorded its 500th duck curve day on September 21, 2026, with the 100th annual occurrence arriving by September 6.
- System demand hit a record low of 5,318 MW on April 20, 2025, driven by behind-the-meter solar output.
- Behind-the-meter photovoltaics generated an estimated 9,926 GWh in 2025, accounting for a significant share of regional consumption.
ISO New England has reached a significant operational milestone with the recording of its 500th "duck curve" day. This event occurs when midday electricity demand falls below overnight levels, a phenomenon driven by the proliferation of behind-the-meter photovoltaic (BTM PV) systems. The 500th instance was logged on September 21, 2026, serving as the 107th such day within the current calendar year.
The frequency of these low-demand periods has accelerated sharply over the past five years. While it took nearly five years to accumulate the first 100 duck curve days, the region added the next 100 in just 13 months. The pace has continued to quicken, with only 221 days separating the 400th and 500th occurrences. This trend reflects the steady increase in distributed solar capacity within the New England grid.
Accelerating frequency of midday demand drops
The region’s first duck curve was observed on April 21, 2018. Since then, the annual count has grown consistently, with each year since 2023 recording at least 100 such days. The timing of the 100th annual duck curve has also shifted earlier each year, moving from November 30, 2024, to September 13, 2025, and further to September 6, 2026. This indicates that the impact of solar generation on grid demand is becoming more pronounced earlier in the calendar year.
Record low demand and solar output
The deepest demand drop to date occurred on Easter Sunday, April 20, 2025, when system demand hit a record low of 5,318 megawatts (MW) around 2 p.m. ISO New England estimates that without BTM PV contributions, demand would have been more than double this figure. Additionally, on March 29, 2026, the region saw its largest spread between overnight and midday lows, with demand falling from 11,667 MW at 3 a.m. to 7,261 MW at 1 p.m., a difference of 4,406 MW.
Solar generation from these distributed sources has also reached new highs. The greatest estimated BTM PV output occurred on April 8, 2026, reaching 7,068 MW around 1 p.m. In 2025 alone, these resources generated an estimated 9,926 GWh of electricity, representing a significant portion of the region’s total grid consumption, which stood at 117,744 GWh for the year.
Operational patterns and grid implications
Duck curves are most pronounced on spring weekends and holidays, when solar productivity is high and baseline demand is low due to mild temperatures and reduced commercial activity. However, the phenomenon is no longer limited to these periods and can occur in any season if weather conditions align. The region holds a record of nine consecutive duck curve days, achieved twice in 2025. These events highlight the growing role of distributed solar in shaping real-time grid dynamics.