Brent Crude Hits $104.33 per Barrel
Brent crude settled at $104.33 per barrel, a 35-cent daily increase and a significant jump from last year.
Brent crude oil reached $104.33 per barrel at 8:00 a.m. Eastern Time. This marks a 35-cent gain from the previous morning. The price stands roughly $37 higher than the level recorded one year ago.
Market volatility remains high. Supply and demand dynamics drive these shifts. Geopolitical tensions and economic recession fears accelerate price movements. The source GN auto markets/energy: crude oil prices tracks these daily fluctuations.
Fuel costs follow crude trends
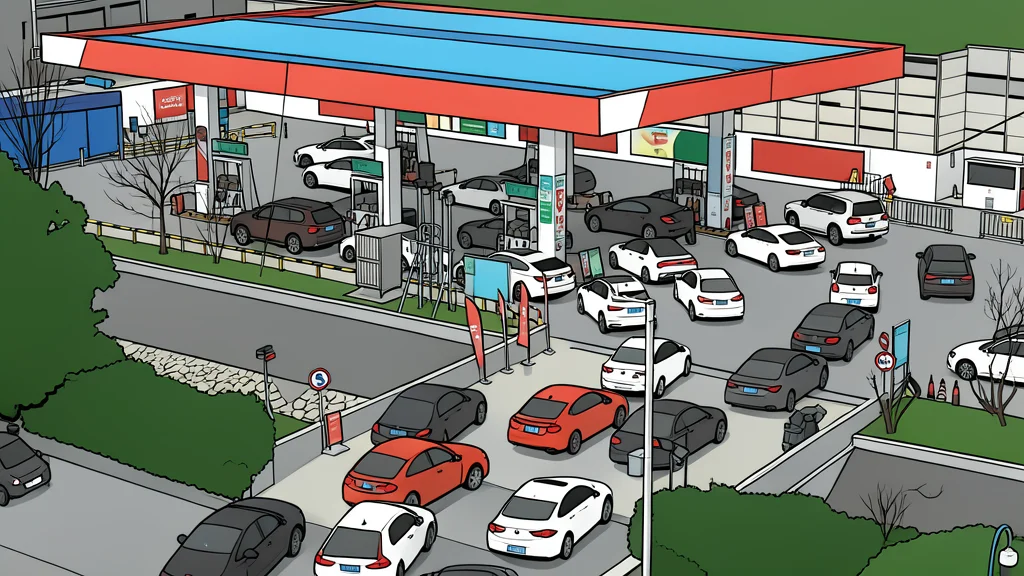
Gas pump prices reflect more than just crude oil. Refining costs and taxes add to the final price. Local station markups also contribute to the total. Crude oil comprises the majority of the per-gallon cost. When oil prices rise, pump prices typically follow.
Price declines often lag behind. This asymmetry is common in energy markets. Consumers see rapid increases but slower decreases. The structural costs remain fixed regardless of crude movements.
Strategic reserves provide temporary relief
The U.S. Strategic Petroleum Reserve acts as a buffer. It stores crude oil for emergency use. Its purpose is to ensure energy security during disasters. It helps soften price spikes during supply shocks.
This is not a long-term solution. It provides temporary relief for consumers. It keeps critical industries running. Emergency services and public transportation rely on this stability. The reserve addresses immediate crises rather than structural market issues.
Historical volatility defines oil markets
Brent crude serves as the global benchmark. It tracks the performance of traded crude worldwide. Historical data shows extreme fluctuations. Wars, recessions, and supply cuts cause spikes.
The 1970s saw the first major oil shock. Middle East export cuts drove prices up. The mid-1980s brought a price drop. Lower demand and new producers reduced costs. In 2008, demand spikes raised prices before the financial crisis caused a crash.
The 2020 pandemic collapsed demand. Prices fell below $20 per barrel. These events demonstrate the market's instability. Policy changes and OPEC decisions also influence trends. The market remains sensitive to global events.