US Existing Home Sales Fall 2.0% to 3.98 Million Annual Rate
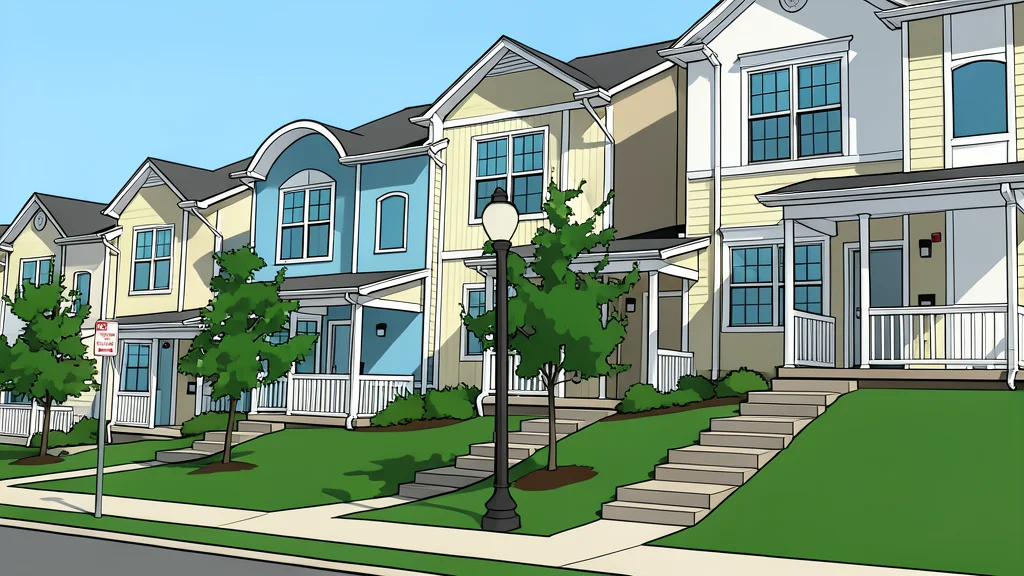
US existing-home sales dropped 2.0% month-over-month in August, landing at a seasonally adjusted annual rate of 3.98 million, per NAR data.
US existing-home sales dropped 2.0% month-over-month in August. The seasonally adjusted annual rate reached 3.98 million units. This figure represents a 1.2% decline compared to August of the previous year. The National Association of Realtors released the data this week. Activity slowed in the Northeast, Midwest, and South from July levels. Sales in the West remained flat.
Total housing inventory climbed 3.2% from July to 1.62 million units. This marks the first time inventory has exceeded 1.6 million units since November 2019. The supply of unsold homes now lasts 4.9 months. That is the highest level in more than a decade. Inventory was up 5.9% from August 2025.
Housing prices continue rising trend
The median existing-home price hit $429,100. This is a 1.6% increase from the prior year. Prices have risen for 38 consecutive months. Single-family home sales fell 1.9% to a 3.62 million annual rate. The median single-family price reached $434,800. Condominium and co-op sales declined 2.7% to 360,000 units.
Affordability index improves across regions
The Housing Affordability Index stood at 104.7. This compares to 101.2 a year earlier. Affordability improved in all four US regions. The West saw the largest gain at 5.9%. The South rose 4.5% and the Midwest 1.7%. The Northeast increased by 0.5%. These gains reflect lower mortgage rates offsetting price increases.
Regional sales data shows mixed results
Northeast sales fell 4.0% to a 480,000 annual rate. Midwest activity dropped 3.1% to 940,000 units. The South declined 1.6% to 1.84 million units. West sales held steady at 720,000 units. Median prices rose in the Northeast, Midwest, and South. West prices fell slightly by 0.2% year-over-year. GN auto markets/housing: home sales reports confirm these figures.